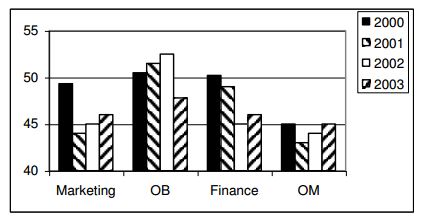
A management institute was established on January 1, 2000 with 3,4,5, and 6 faculty members in the Marketing, Organisational Behaviour (OB), Finance, and Operations Management (OM) areas respectively, to start with. No faculty member retired or joined the institute in the first three months of the year 2000. In the next four years, the institute recruited one faculty member in each of the four areas. All these new faculty members, who joined the institute subsequently over the years, were 25 years old at the time of their joining the institute. All of them joined the institute on April 1. During these four years, one of the faculty members retired at the age of 60. The following diagram gives the area wise average age (in terms of no. of completed years) of faculty the members as on April 1 of 2000, 2001, 2002, and 2003.
In which year did the new faculty member join the Finance area?